What does the process data webinar cover?
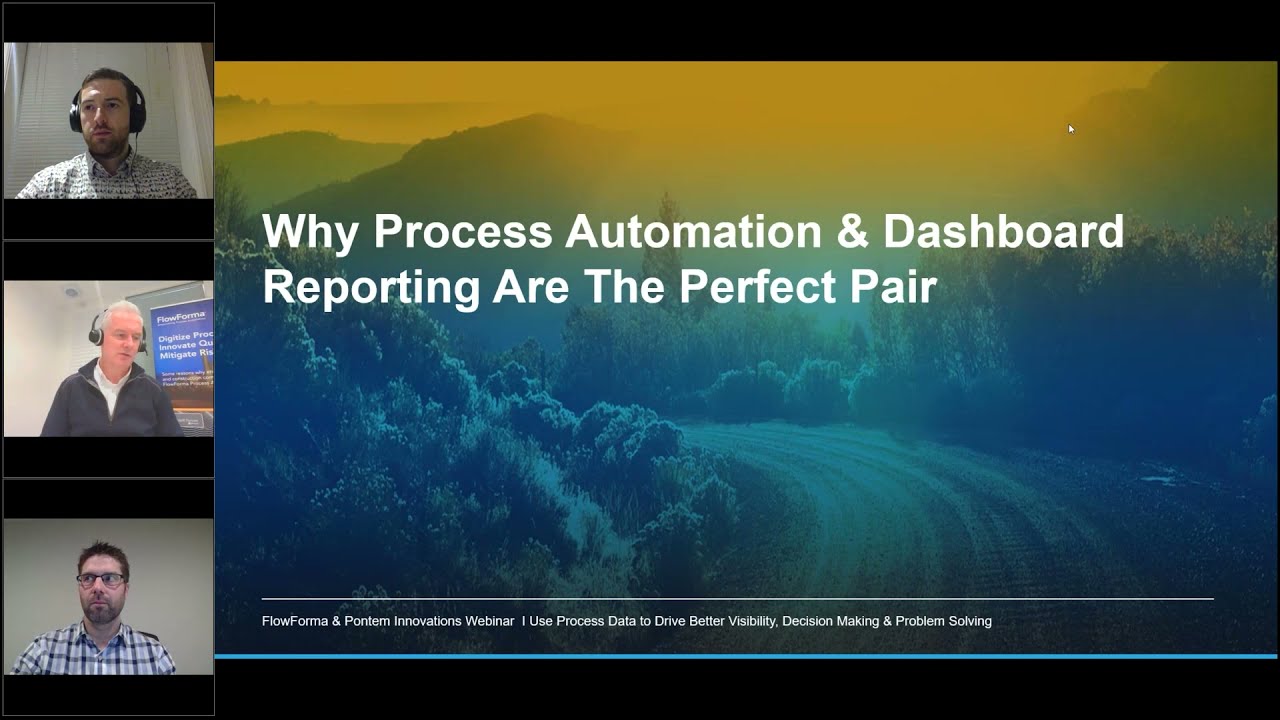
FlowForma's Shay O'Connor and Pontem Innovations' Rick Dowell and Cameron Fox explain how process automation and reporting work together, share three steps to better data visibility, and demo two customer examples that pair FlowForma forms with Power BI.
What are the three steps to better data visibility?
Find an internal champion with both top-down and bottom-up support, take a phased approach one process at a time, and keep improving as the data shows you what to change.
How does FlowForma work with Power BI?
FlowForma forms capture structured data that you control and store in your own environment, such as SharePoint or Azure. Power BI then reports on that data, and with FlowForma's advanced reporting features the reports can update in real time.
What results did the oil and gas example show?
An Alberta oil and gas services company replaced Excel, Access and Word with one FlowForma form for non-conformance reporting. Individual reports are generated automatically, and Pontem estimates it saves around 60% of the time.
How did Morgan Construction use FlowForma?
Its recruitment team moved onboarding out of an Excel spreadsheet shared by around 15 people into a FlowForma process, with Power BI showing how many new hires are waiting at each step, such as orientation or IT and HR.
How quickly can you get started?
Give yourself a few weeks for your first FlowForma process. With structured data in place, a couple of simple Power BI reports can take a few hours, and more detailed reporting can be ready within a week.